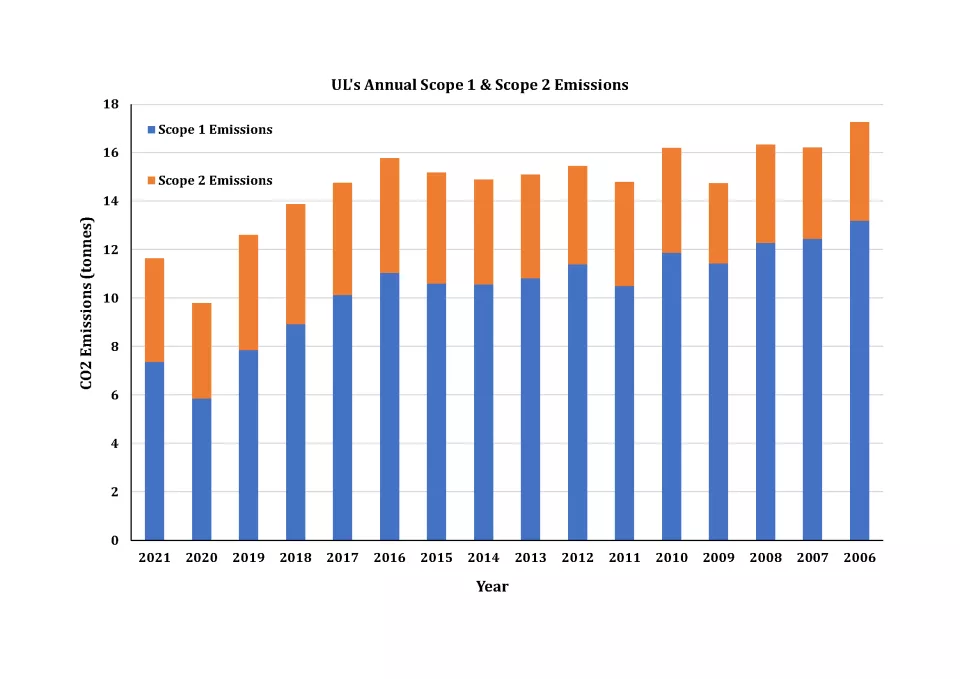
To establish the efficacy of environmental initiatives on campus, Buildings and Estates measures and monitors various key indicators.
The below graphs provide historical information on some key parameters UL are measuring including:


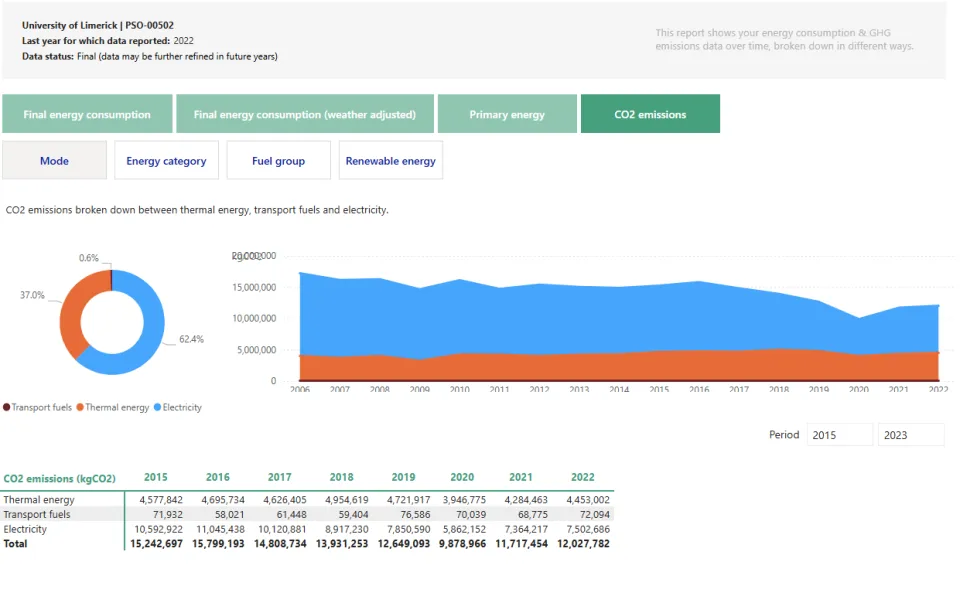
For item 7 above: The pie chat shows that UL’s CO2 emissions are dominated by electricity (accounting for 62.4%) followed by gas (accounting for 37%) and the balance (of 0.06%) made up by transport fuels.
The line chart shows that UL’s CO2 emissions have gradually reduced over time from just under 15,243 tonnes in 2015 to just under 12,028 tonnes in 2022.
The methodology in determining UL’s CO2 emissions is set out in this link. Further information on the reporting system used to collect this information is available here.